
Probabilistic Results
 Probabilistic results are those yielded by a full-cycle Monte Carlo simulation.
Selecting the main Probabilistic node you can see the MC simulation details: version used, date and hour, Random Seed Number, execution time and forecast period settings (see General Tab).
Within Probabilistic results, sub-nodes contain different kinds of data concerning probabilistic simulation inputs, results and their analysis:
 Results: Single value results are displayed in the upper half of the pane in tabular form. Columns in the table contain various measures of the variable distribution: Mean, Minimum, Maximum, Standard Deviation (SD), Variance (Var(unit^2)), Skewness, Kurtosis, Standard error of mean, and Iterations. By double-clicking single value rows (or selecting the Distribution option in the right-click menu) you can open the Single Probabilistic Results Window where cumulative probability and frequency distributions are displayed as graphs.
- Array results are shown at the bottom; the graph on the right displays its statistical density over time. The solid line represents the mean; the dashed line represents the percentile 50, and the dotted lines represent percentiles 25 and 75. In the right-click menu, the Percentile range option allows you to restrict the displayed percentiles to those of higher frequency (between Min-100% and 45%-55%), or to display only the Mean and P50. There is also an option to Send Mean to User Graph; see User-Defined Graphs.
- By double-clicking array values in the list (or selecting the Distributions by period option in the right-click menu) you can open the Array Probabilistic Results Window, where a separate analysis of the result for each period is provided.
 Distributions: All variables for which a distribution has been defined are listed in tabular form, including all inputs entered in the Distribution Selection window. By double-clicking variable rows you can open the Single Probabilistic Results Window where cumulative probability and frequency distributions are displayed as graphs. Right-click options to copy table Data or Graphs (or Both) and later pasting in Excel are available.
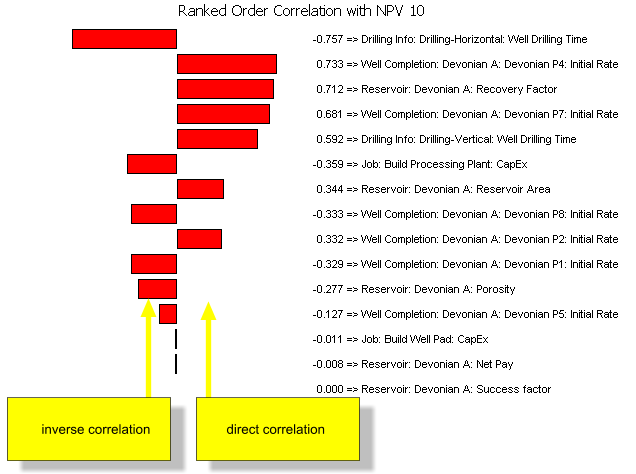
  Correlation ranks: This node contains graphs of correlation coefficients between results (selected in the list on the left) and input variables with uncertainty. Inverse correlation is indicated by negative values, where the red bar extends toward the left. The Ranked Order Correlation diagram is calculated according to the following equation:

 Cross Plots: This node allows you to create a cross plot of any two probabilistic inputs or results selected for the Monte Carlo run. See further under Cross Plots.
 Data: This node displays the values assumed in each iteration by variables with distributions and by results selected for the Monte Carlo run. See further under Data Node.
The information contained in the Results, Distributions and Data nodes can be output to Excel; see Econ Reports.
After running Monte Carlo, PetroVR computes the percentiles of all its results from the samples obtained for each of them. In the case of continuous variables (that is, all except those with Cumulative and Discrete distributions), the percentiles are calculated by interpolating the samples. In doing this, samples are laid out in increasing order over the X axis. For each of these values, their cumulative probabilities are plotted on the Y axis. Then the points on the XY-plane are linearly interpolated and this constitutes the cumulative probability distribution of the result. Finally, percentiles are calculated from their (interpolated) cumulative distribution.
If a result has yielded an undefined value in one or more iterations, the mean value is left as undefined and not represented; Density graphs are not built; correlated ranks between an output that contains undefined values and any other output will also be undefined; and Distribution and Reverse Distribution plots do not reach 1 on the probability axis x because undefined values are neither below or above the maximum defined value. If a result yields undefined values in all the iterations, the graph will be empty. A typical example of this is the occurrence of undefined IRR results due to the NPV being always positive or always negative; see Financial Functions.
When you save a Monte Carlo iteration as a separate project, only the realization of Plan is saved. Other files such as .eco or .act are omitted.